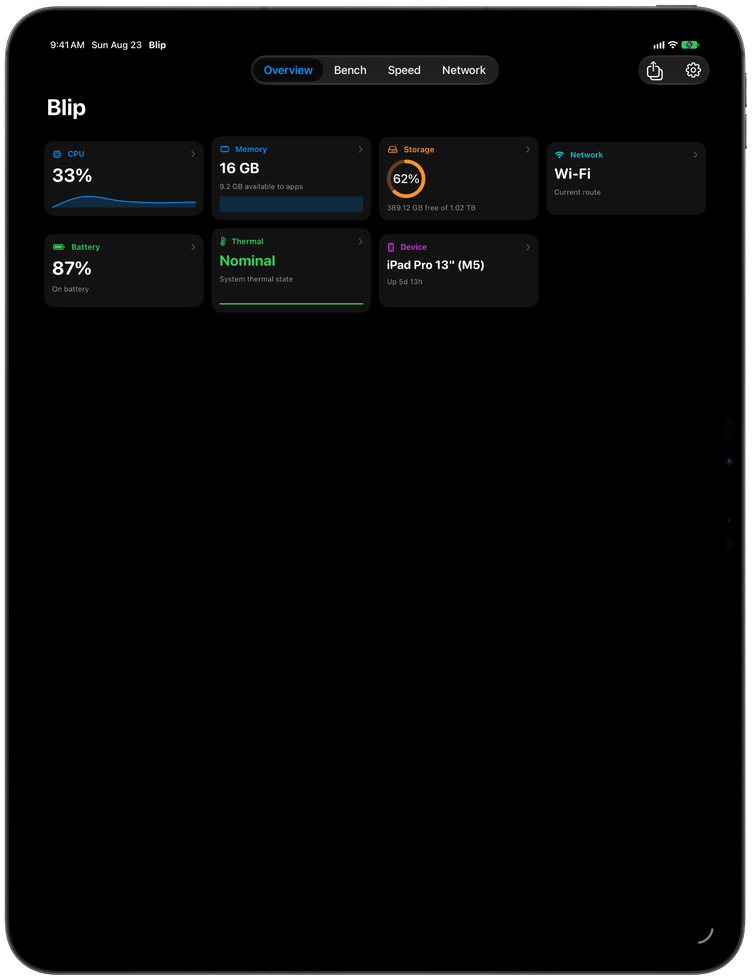
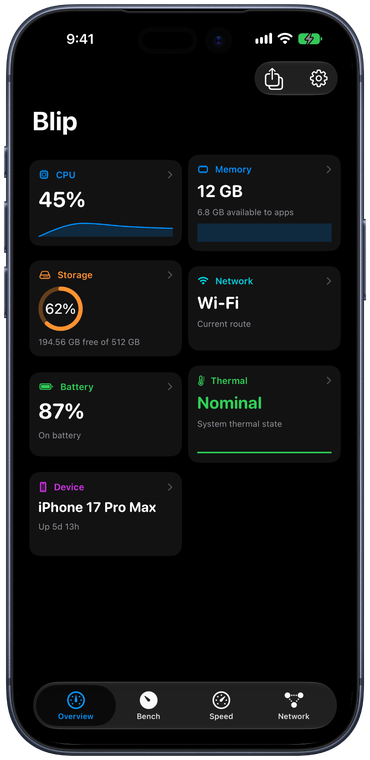
Blip is a featherlight system monitor for Mac, iPhone, and iPad — CPU, memory, disk, GPU, network, battery, and a real benchmark. Beautiful charts, tiny footprint, completely free.
Interactive demo — double-click the menu bar to cycle styles. Some differences may be present in the installed native Mac app.
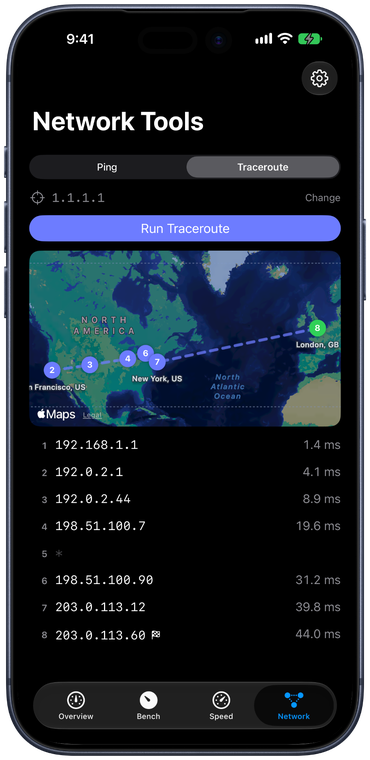
One free app across Mac, iPhone, and iPad. Live device cards with drill-in details, Blip Bench with Neural Engine scoring, graded speed tests, ping and traceroute with an offline hop map, disk speed tests, widgets, and Shortcuts.
CPU, memory, GPU, and Neural Engine throughput in fixed reference units — one scale for every Mac, iPhone, and iPad running Blip, with a sustained phase that measures thermal throttling.
Download and upload draw as separate curves, latency is measured idle and under load, and every result is graded per activity — from video calls to cloud gaming.
Ping and traceroute with per-hop latency and an offline GeoIP map of the route. The location database downloads once; lookups never leave the device.
Bench score, storage, and your last speed test on the Home Screen — each stamped with its age — plus Shortcuts to automate benchmarks, speed tests, and stats snapshots.
Blip comes to iPhone and iPad — and Blip Bench scores every device on one scale, Neural Engine included.
Eight actions make Blip's monitoring and diagnostics scriptable from the Shortcuts app and Spotlight. Chain live metrics into your own automations — press ▶️ to run this one.
One action exposes every number Blip tracks as a chainable result, searchable right in Shortcuts — try the search below. The seven charted metrics also offer average / min / max over Blip's in-memory ~2-minute history.
Every volume in the Disk panel now carries a gauge button that targets that drive and runs the uncached write/read + random-IOPS benchmark in one click — external drives included (the App Store build one-click-confirms access to them). Results land in the same history sparkline as the Disk panel's speed test. Click a gauge to try it.
Blip monitors what matters and stays out of your way.
Total and per-core usage, user/system/idle breakdown, load averages (1m/5m/15m), P-core and E-core counts. Accurate delta-based CPU per process with app icons.
App memory, wired, compressed breakdown matching Activity Monitor. Swap usage, cached files, kernel-level pressure indicator. Accurate phys_footprint memory per process.
Space used and available for all mounted volumes. Real-time read/write speeds via IOKit with total data read/written since boot. Full S.M.A.R.T. drive health — SSD life remaining, drive temperature, lifetime bytes written, power-on hours and more, now including external USB/SATA SSDs. New in v1.5.0: a built-in disk speed test with live Writing…/Reading… phases, sequential write/read MB/s, random-read IOPS, history sparkline, and optional interval testing — benchmark the boot drive or any external volume — plus an I/O chart with Y-axis labels. New in v1.6.0: every volume row gets a gauge button that targets that drive and runs the benchmark in one click.
Upload/download speeds with accurate 64-bit session totals, all active interfaces, WAN and router ping, IPv4/IPv6, MAC address, WAN IP reveal, VPN detection. New in v1.5.0: live Traceroute / MTR with per-hop loss & latency that fills in hop-by-hop — with a geolocation map (powered by an optional on-device database you download yourself, so hop locations never leave your Mac) that plots the route across the world — and a multi-gigabit speed test that runs against your own self-hosted OpenSpeedTest server (open-source, sanctioned, unlimited). Bandwidth chart with Y-axis labels.
Top CPU and memory consumers with real app icons, accurate delta-based CPU and phys_footprint memory. New in v1.5.0: hover any process to reveal a quit control — one click arms it, a second click terminates the process right from the panel.
New in v1.5.0: a dismissable “Suggestion” banner surfaces actionable advice to improve performance, health, and longevity — runaway-CPU apps, high memory pressure or heavy swap, thermal throttling, a nearly-full startup disk, S.M.A.R.T. warnings, low SSD life, and weak battery health. Highest-severity first; dismissed items stay hidden for 24 hours or until the condition worsens.
Apple Silicon GPU utilization percentage with renderer name. Historical usage chart shows GPU load over time with smooth monotone interpolation.
Charge level, health matching Settings app, battery condition, cycle count, temperature, charging status. Fan RPM with min/max ranges.
Historical sparklines for CPU, memory, and GPU. Bandwidth and disk I/O charts with auto-scaled Y-axis labels. Detail panels live-refresh as data changes.
~2 MB binary. Zero external dependencies. Polls every 2 seconds with efficient ring buffers. Shows its own memory usage in the footer.
Category colors, monochrome, or custom color via picker. Optional utilization colorization. Two layouts (horizontal/stacked). Toggle individual items and labels. Launch at login.
New in v1.6.0: automate Blip from the Shortcuts app. Get System Metric exposes 37 live metrics (CPU, memory, disk & S.M.A.R.T., GPU, network, battery, temps, fans, uptime) as chainable numbers — with average/min/max over the last two minutes for charted metrics. Run a drive speed test on any volume, run a network speed test, run or stop a traceroute and get an MTR summary, open the Traceroute Map, and read or change curated settings — all from your own workflows. Five zero-setup App Shortcut phrases work with Siri and Spotlight out of the box.
Zero telemetry, zero tracking, zero analytics. Blip has no servers and never sends your data to us, and the traceroute map geolocates entirely on-device from an optional database you download yourself — no third-party lookup. The only network connections are ones you start: the speed test talks only to the OpenSpeedTest server you self-host, and WAN-IP reveal.
Blip is free — no ads, no tracking, no subscription. If it earns a place on your Mac, you can help fund what comes next.
Blip is built exclusively for Apple Silicon (M1, M2, M3, M4 and newer). It uses ARM64-specific optimizations and Apple Silicon IOKit interfaces for GPU and thermal monitoring.
macOS 14.0 (Sonoma) or later. Blip uses Swift Charts and other APIs introduced in macOS 14.
Typically around 42 MB physical footprint. Blip shows its own memory usage in the popover footer so you can always check. The binary itself is around 2 MB.
Blip needs to read hardware sensors (SMC for fans, IOKit for GPU/disk I/O, process list for top apps) which require unsandboxed access. The app is fully open source — you can audit every line of code, and every release is notarized by Apple. There is no telemetry or tracking of any kind — no analytics, no crash reporters, no network calls home. No server infrastructure is used or needed for Blip to work; everything runs entirely on your Mac. The app has been security audited to ensure the utmost care in being a safe app for use.
Hover over any row in the main popover to reveal a detailed sub-panel to the side — just like iStats Menus. It shows charts, breakdowns, and top processes for that category.
Yes. Open Settings (gear icon in the popover) and toggle individual items: CPU, Memory, Disk, Network dot, and labels. You can also set a custom accent color.
Yes — Blip Stats 2.0 is one free app across Mac, iPhone, and iPad. The iOS app shows live device stats with drill-in details, runs Blip Bench (including the Neural Engine), tests network and disk speed, does ping and traceroute with an offline hop map, and ships Home Screen widgets and Shortcuts.
Yes — on every platform. The Mac direct download, the Homebrew cask, the Mac App Store build, and the iPhone/iPad app are all free with no paid tier and nothing to unlock. If you'd like to support development, use the links above.
Clone the repo, install XcodeGen (brew install xcodegen), run xcodegen generate, then build with Xcode or xcodebuild. See the README for full instructions.
Open source, and built for Apple Silicon.
Optional: Download Blip Helper for fan speeds, temperatures, GPU utilization, disk I/O, battery health, and process monitoring when using the App Store version.